In what’s becoming a bit of a New Year’s tradition, the Bond Kings are out with some early ruminations on the prospective end of the three-decade young bond bull. Never one to pull a punch, Bill Gross of Janus Henderson went full-bear (not to be confused – although admittedly, quite similar to – fubar), bluntly stating on Twitter, “Bond bear market confirmed today.”
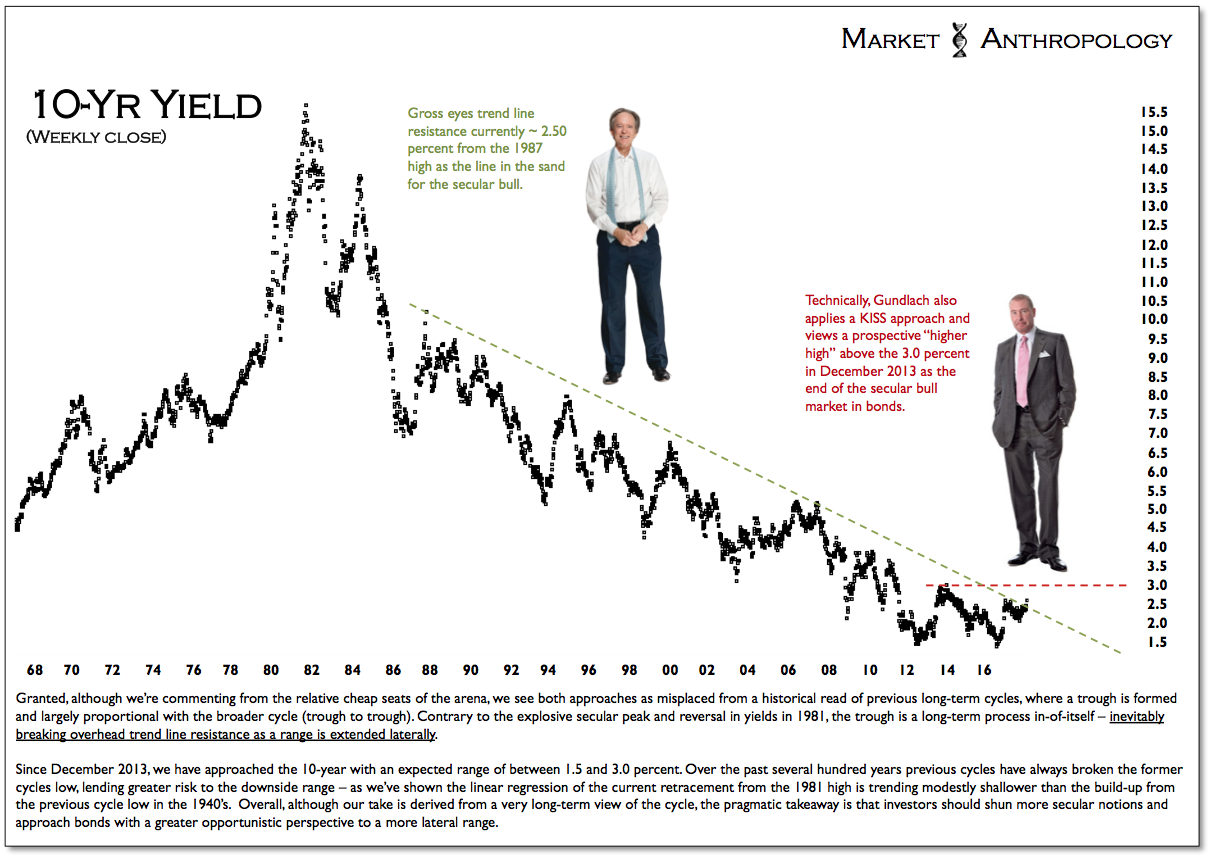
While definitely less sanctioning, although still glazed with concern, Jeff Gundlach of DoubleLine eyes 2.63% on the 10-year yield as a trigger to sell long-term Treasuries, with a break above the late 2013 highs ~3 percent on the 10-year as the delineating line in the sand for the secular cycle.
If it all rings too familiar, they did issue similar pronouncements last year – practically to the day – calling for the end of the secular rally in bonds.
________________________________
Jeffrey Gundlach said the 10-year Treasury yield topping 3 percent would signal the end of the three-decade long rally in bonds.
“Almost for sure we’re going to take a look at 3 percent on the 10-year during 2017,” Gundlach, the chief executive officer of DoubleLine Capital, said Tuesday during his annual “Just Markets” webcast from New York. “And if we take out 3 percent in 2017, it’s bye-bye bond bull market. Rest in peace.”
Bond manager Bill Gross at Janus Capital Group Inc. has a different threshold. He said in an investment outlook released earlier in the day that benchmark Treasuries above 2.6 percent would spell the end for the bond bull market.
“The last line in the sand is 3 percent on the 10-year,” Gundlach said. “That will define the end of the bond bull market from a classic-chart perspective, not 2.60.” – January 10th, 2017Bloomberg
________________________________
Although we do find merit (over a much shorter timeframe) in Gundlach’s “KISS” technical criteria of simply using a higher high to trigger a shift in market posture, as we commented on last January (see below), we view both approaches as broadly misplaced from a historical read of previous long-term cycles, where a trough is formed and largely proportional with the broader cycle (trough to trough). Contrary to the explosive secular peak and reversal in yields in 1981, the trough is a long-term process in-of-itself, inevitably breaking overhead trend line resistance as a range is extended laterally.
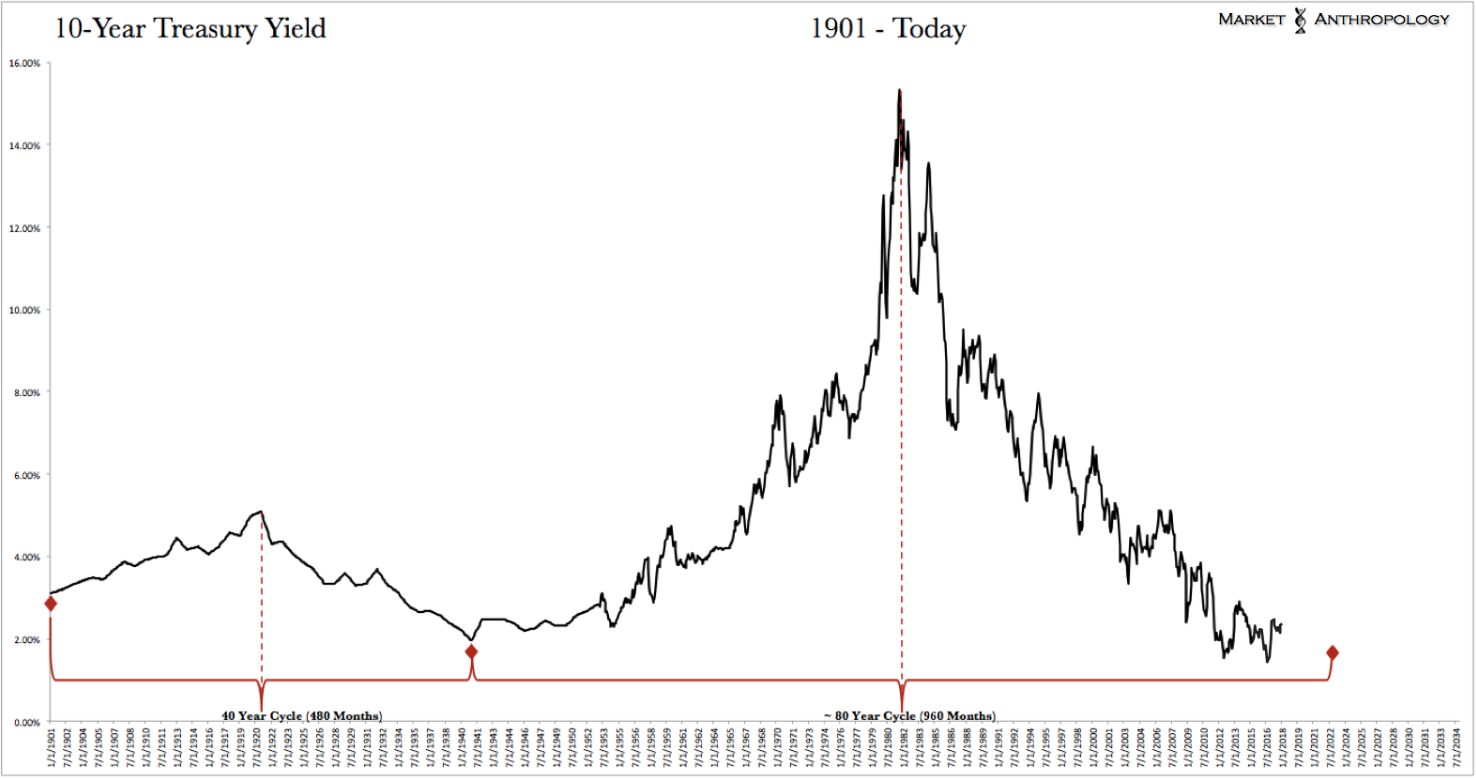
This week, markets are knocking on that inevitable door – the question is, secularly speaking: Does it hold any broader significance if and when we walk through it? Considering the massive and overarching size of the secular cycle (see Here) and echoing our thoughts below from last January – we don’t believe so.
________________________________
While Gundlach and Gross have a semantic squabble over the upside threshold in yields that might delineate the end of the three-decade old bull market in bonds, perhaps they should stop viewing the bond world as round and come to the apparent reality that it’s more flat than circular here in the trough of the long-term cycle.
In this construct, the unidirectional sovereign yield winds died – or more appropriately – transitioned, years back in 2011 and 2012. Although short-term yields and the dollar have risen in tandem as the US economic expansion led the world out of the financial crisis, long-term yields have taken a more lateral path into the trough with what we suspect will be doldrum conditions blowing east to west at best – rather than the prevailing winds we experienced out of the north for thirty years. How long the journey along this yield equator will take is anyone’s guess, but by our estimation of previous long-term cycles (most recently, Here), likely has further seas to float before the strong updrafts of the Westerlies can bring us to the higher-latitudes of a “New World”. – January 19th, 2017 Market Anthropology
________________________________
That said – and considering our suspicions of a continuing trend of higher realized inflation, we wouldn’t be surprised if the 10-year was squeezed for a spell firmly over Gross’ threshold and up to Gundlach’s line ~ 3 percent. In this scenario – and maintaining our approach since early 2014 (see Here) to a potential troughing range in long-term yields – use the span between 1.5 and 3 percent in the 10-year yield as a guide towards opportunistic trading windows in Treasuries.
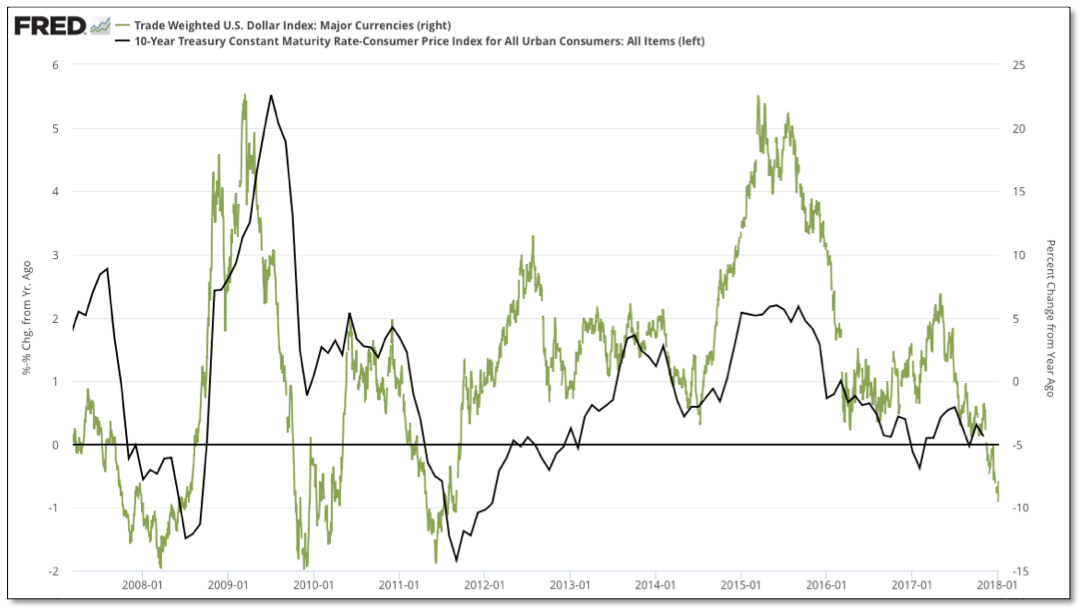
With the release of the December CPI report tomorrow morning, markets will have fresh catalyst to work through as they skate towards the first Fed meeting of the year at the end of this month. Despite this mornings PPI report coming in weaker than expected, year-over-year performance in the US dollar hit an over 6-year low coming into 2018, which as we have shown in the past leads the trend in real yields (shown below through 10-year less CPI/year-over-year).
Although the threat of inflation appears to be receiving wider attention in the financial media these days (see Barron’s coverDecember 30th, 2017) – and pundits have cited the risk as impetus for the recent rise in yields, a broader impact to underlying market psychology has yet to take place, one we suspect will eventually adversely affect the lofty and ebullient sentiments currently entrenched in equities.
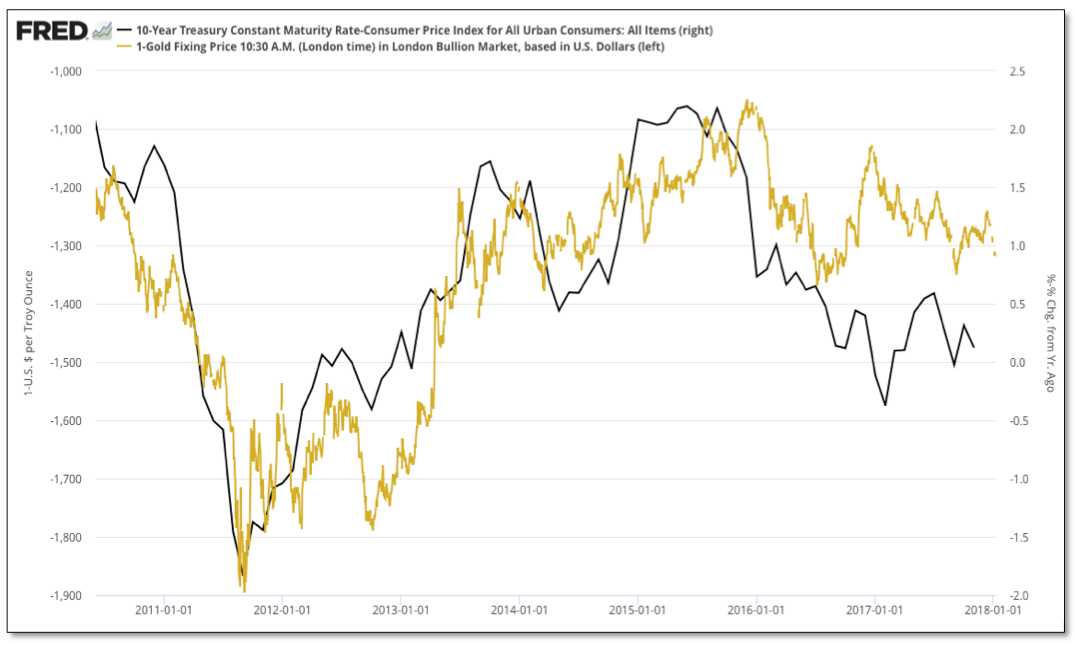
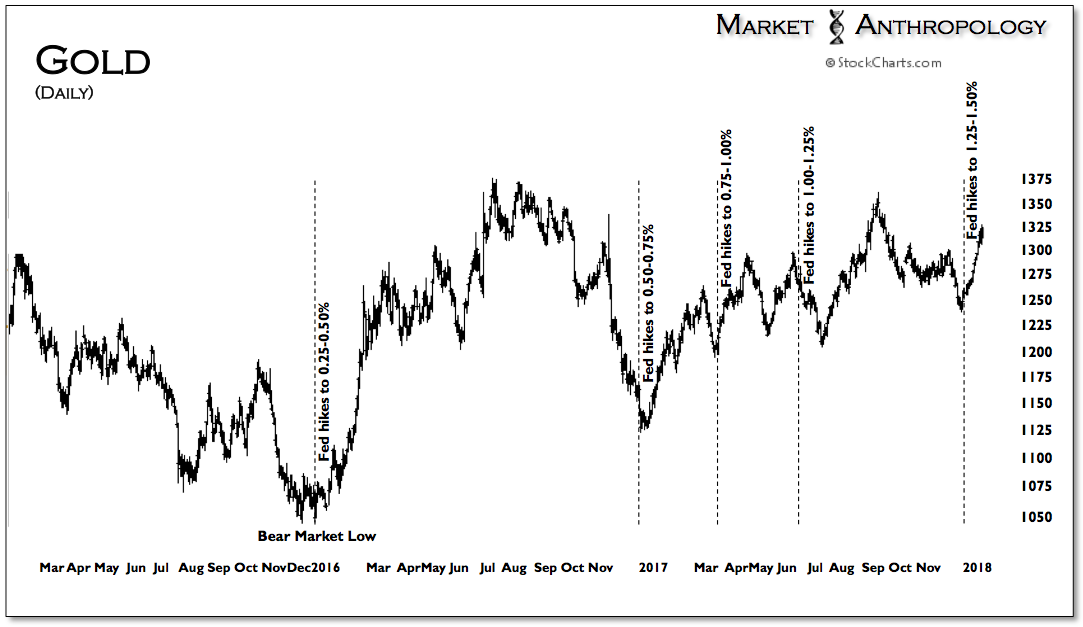
Moreover – and getting back to Gundlach’s initial trigger of 2.63 percent on the 10-year yield, we would look for that break above last years highs to coincide with broader market weakness in equities and potentially an upside breakout in gold. While gold would likely benefit from the more typical safe haven demand, we would also expect real yields to continue to decline as inflation outstrips the reach of nominal yields.