Thought I would do a two month follow-up on the long-term silver analog I created in May that illustrated what I perceived as very good business sense by one Carlos Slim. From my notes on May 15th:
A few weeks back as Zero Hedge wrongfully speculated (surprise, surprise…) that the silver shorts were DOA, because Carlos Slim was about to purchase the remaining physical silver out of the market – Mr. Slim was out actively hedging his own mine production two to three years out. In essence, likely more than doubling the market price he will receive if silver continues to trade along the backside of the parabolic arc as expressed by the Nasdaq, Circa 2000.
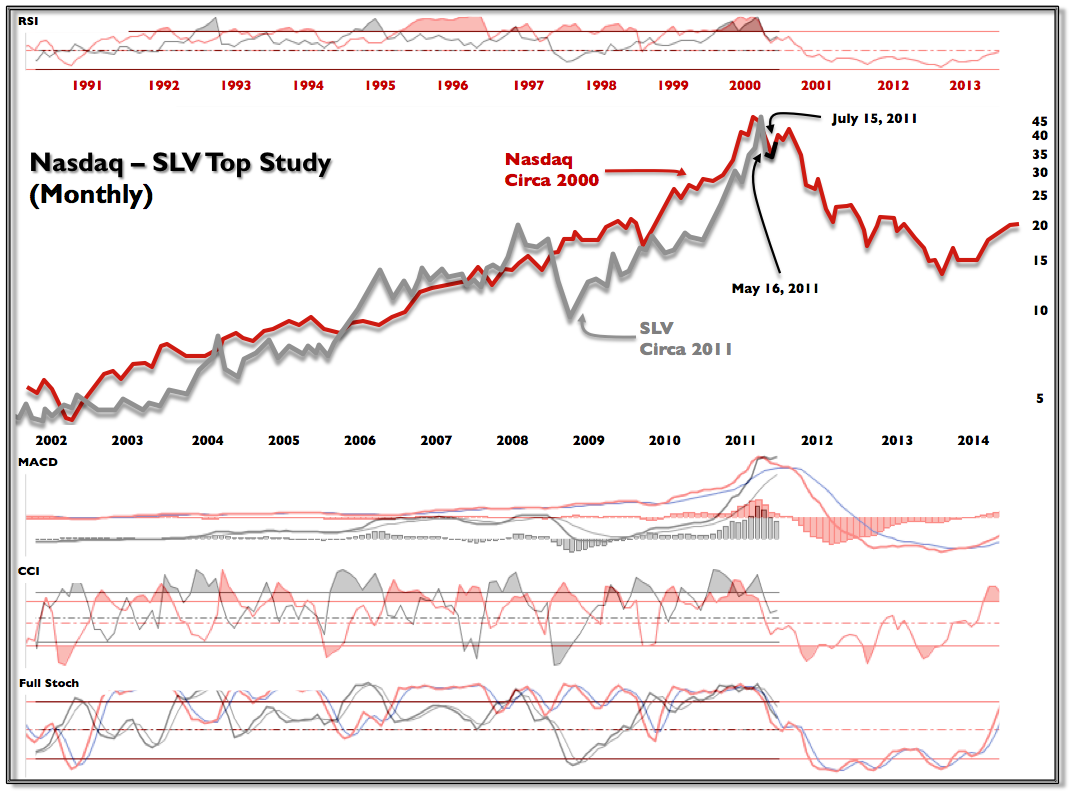
The market pivoted with the analog in July and appears a whisper print away from 40. Should the market continue to follow script – it looks like the top of the range will come in around SLV 42 – after a shallow retracement ~ 40. I do not actively trade off of such a long term analog – perhaps I should be…
Its primary utility to me is to illustrate the arc of a long-term parabolic move and to give basic guidelines of where the market may trade.
Here is another chart that exhibits the trend and performance correlations between the silver:gold ratio and the equity markets over the past decade. Like I have stated in the past, I look at the ratio loosely as a barometer of risk appetite in the markets. Certainly, and historically speaking, it can have greater nuance than that (and I’m sure my mailbox will be filled with excellent reasonings and illustrations) – but for the sake of calibrating momentum – it is a metric I follow.
Since the start of QE2, silver has taken on a mind of its own and is apparently sending the message that the equity markets are substantially undervalued…
That – or one market is irrationally exuberant. My money is on the latter.
Interestingly, today’s tape is further extending that performance divergence.