Physical Address
304 North Cardinal St.
Dorchester Center, MA 02124
Physical Address
304 North Cardinal St.
Dorchester Center, MA 02124
When it comes to analogies on the market, the father of value investing framed it best:

Within our own research approach, we often compare and contrast different market trends with respect to a wide scope of history. Like Graham’s observation, we’ve found “weighing” a trend with various metrics against the scales of history provides greater depth and perspective. For us, history provides identity for the present through congruences and contrasts with the past. And although the past is never a perfect fit, the weight of historical trends and their given market environments provide ample insight to help us better understand the markets we participate in.
That said, comparative reasoning is certainly no crystal ball – just as last years earnings or economic data doesn’t deliver present and future outcomes. What they both can provide is context – and a framework against which we can attempt to quantify and qualify the present. Stepping down from the soapbox – but keeping Graham’s analogy in mind, we thought we would update some charts on Europe and Japan as well as flesh out a few thoughts on related trends.
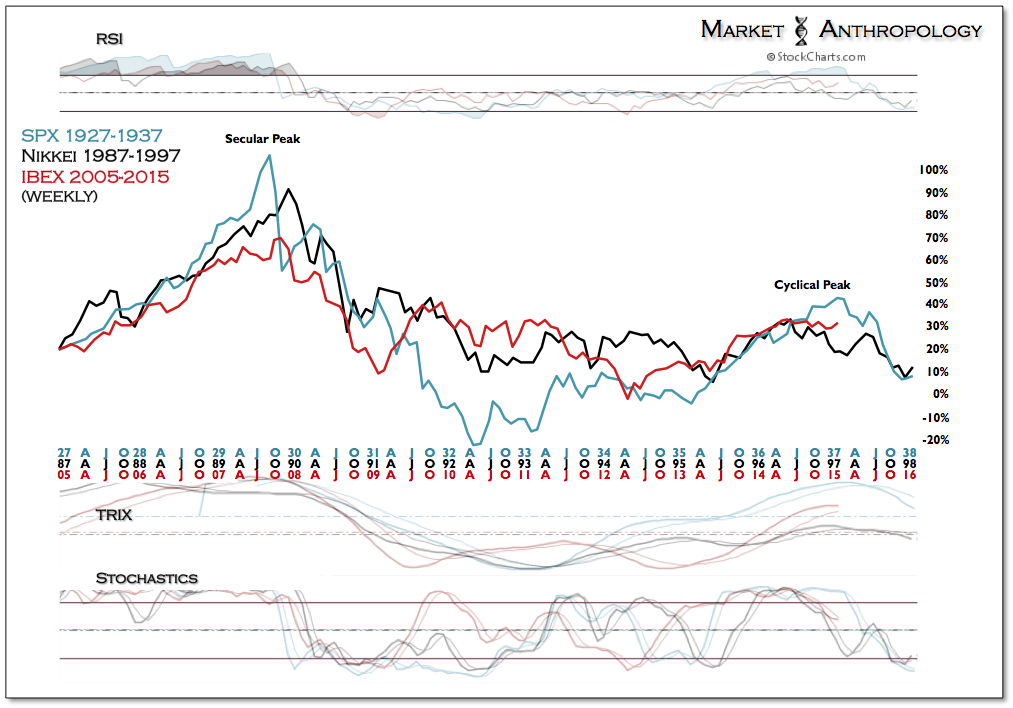
Our higher beta equity proxy for Europe – Spain’s IBEX, continues to walk the tightrope of our historic comparative of the two major perennial asset deflations over the past century. As we laid out in previous notes over the past year, the ECB is attempting to break the glide path of where a cyclical downturn appeared and where deflationary forces caused a policy misstep on behalf of their respective monetary handlers.

 Moreover, it’s important to note that while hindsight provides historians with a more binary outcome to deduce causation and fault lines, the reality is that market trends within deflationary conditions have brittle underpinnings with an increasing degree of difficulty to navigate with policy. We find this is very much the case in Europe as brush fires continue to flare as the respective authorities juggle a disparate ledger of crises – both existential and structural in nature. In many ways Draghi is truly the Man on Wire, with what appears to be a long way to walk over the next year.
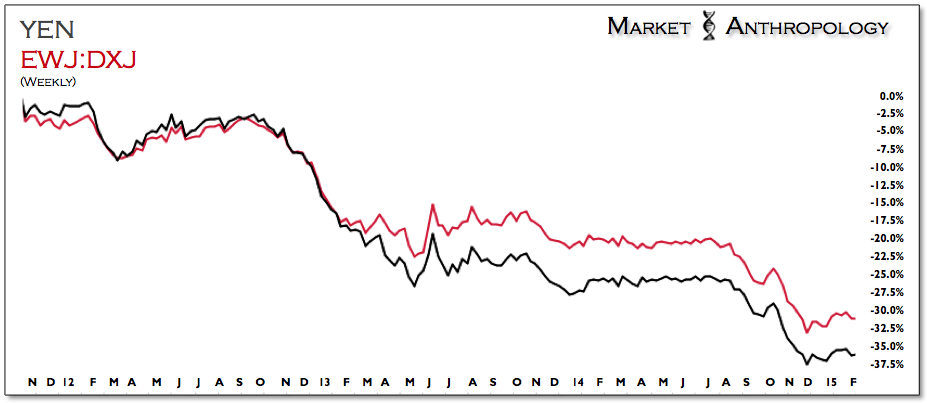
Although it took Japan nearly 25 years to crawl and stumble across its own deflationary span, it appears the Nikkei has succeeded and continues to put more space between the breakout we expected last fall.

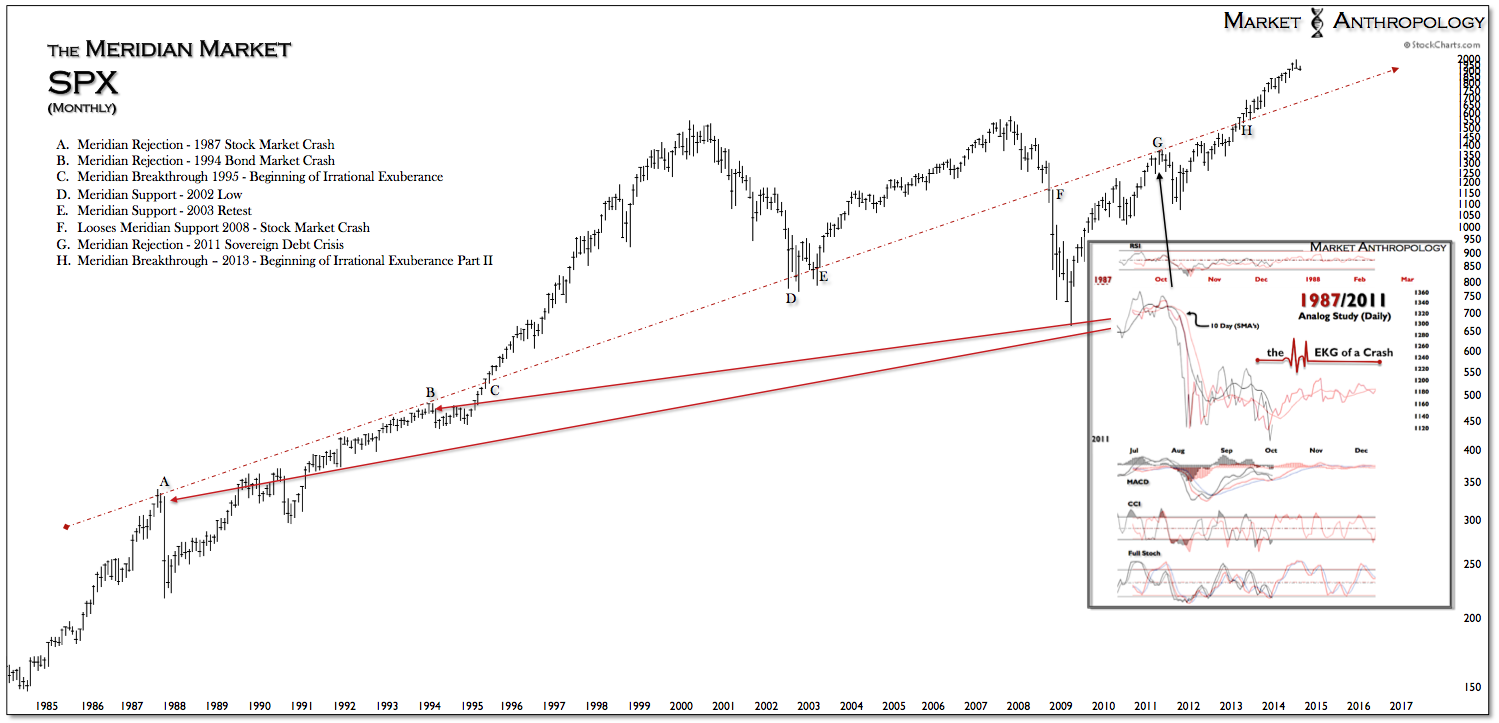
We updated our 1987/1988 Nikkei comparative that we’ve utilized since late 2013 and normalized a weekly study for duration and performance from the respective retracement high/meridian rejections. As shown below, the Nikkei is breaking higher around where its historic comparative pattern began another large leg higher.


