Physical Address
304 North Cardinal St.
Dorchester Center, MA 02124
Physical Address
304 North Cardinal St.
Dorchester Center, MA 02124

In the illustrious wisdom of Don Rumsfeld – there are known knowns.
The cheap thrills of a Halloween horror flick. The ecstatic squeals from your four year old on Christmas morning. The pleasures of indoor plumbing… And along those lines: Stocks drop – when the Fed turns the spigot off.
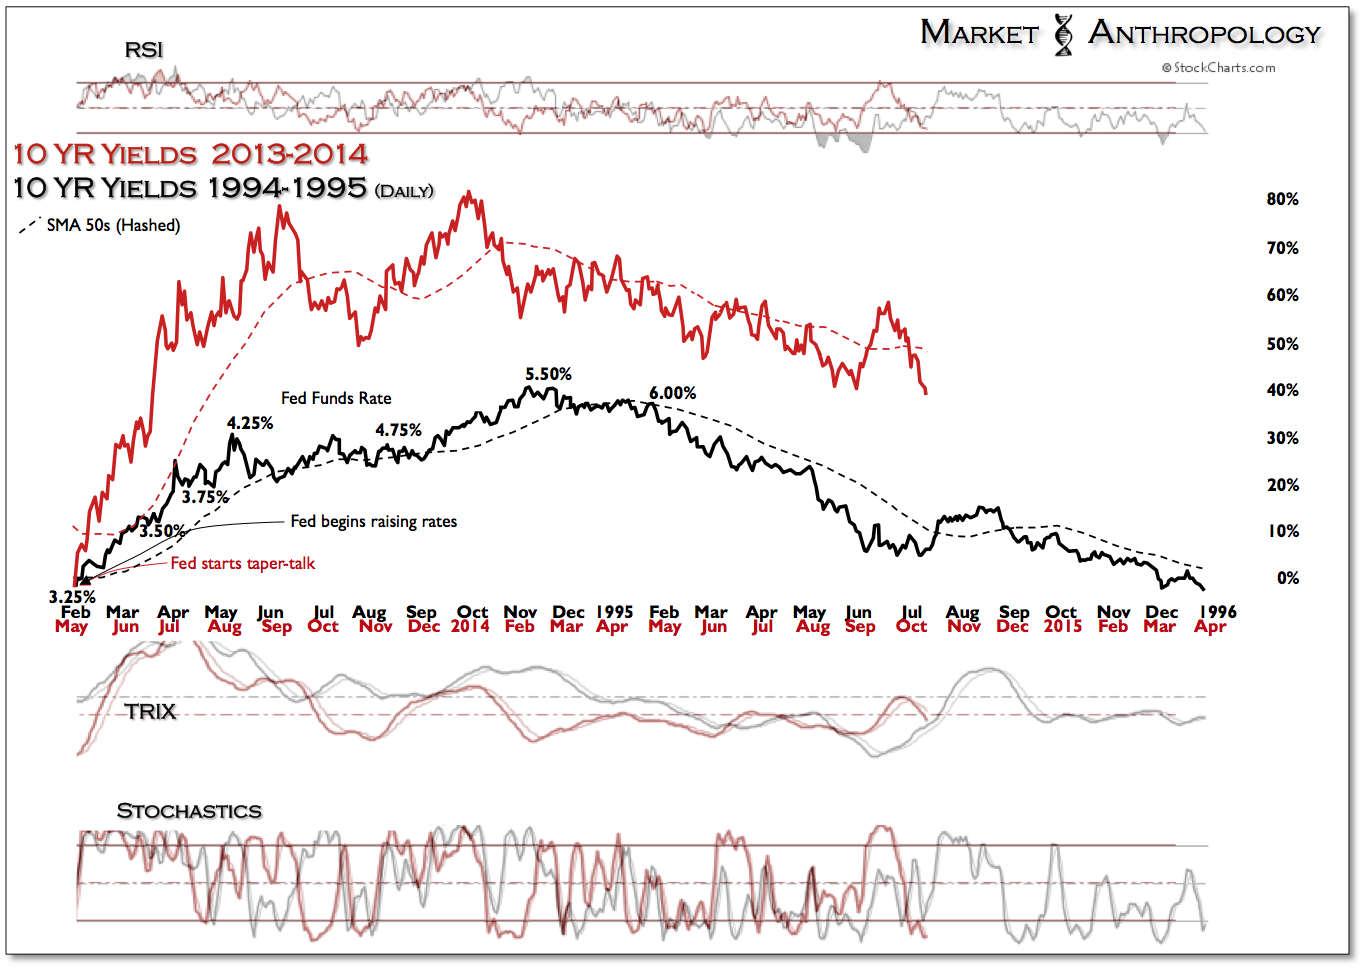
As telegraphed as it has been since the Fed first embarked and outlined the taper last December, the equity and Treasury markets are currently expressing similar reflexes, that had developed on the two previous occasions where the Fed stepped away from policy accommodations in 2010 and 2011. Throw in the perennial spoiler that is the dysfunctional body politic we call Europe, and viola – it’s Groundhogs Day all over again.
Granted, this was largely expected – a known known, if you will. So obvious in fact, that many participants might have dismissed caution going into this fall, with a bit of the old market reasoning – that what’s obvious to the public is obviously wrong. The problem, however, is that we find the current situation more mercantile and less motivated by game theory, per se, when it comes to the structural support extended in the equity markets today. The simple fact remains: since January 2009, all of the equity market gains have taken place during the weeks in which the Fed purchased

Treasury bonds and mortgages – and conversely, the stock market has declined during the weeks in which it has not. While we would certainly agree the market functions and is weighed with a complicated and at times non-linear calculus – or that correlation doesn’t always determine causation; we’d speculate you’re either a pollyanna or just playing advocate for the devil himself, to believe that Fed policy over the past five years, has not materially affected higher valuations in the equity markets. Needless to say, both of those opinions are rarely in short supply these days, either around the markets or in the media.
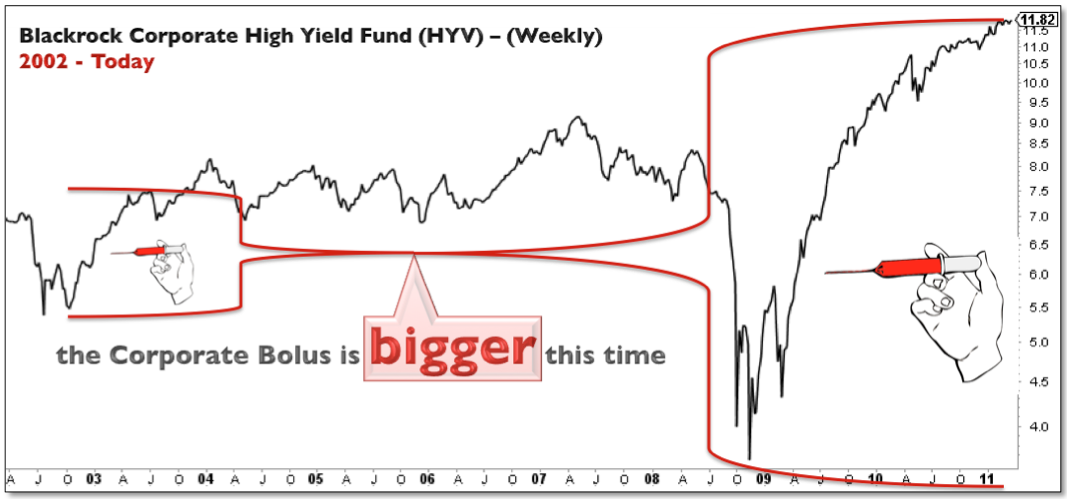
Notwithstanding the convoluted dye traces or reflexive feedback from the structural transmission mechanism itself, just look at who has been the single largest purchasers of stocks today: corporations buying their own secret sauce. Where did that capital come from? Predominantly, from investors that were driven by monetary policy out of the safe haven harbors of the Treasury market and into a concerted reach for yield in the corporate debt markets – that inevitably becomes leveraged into equities through buybacks. Back in March 2011 (see Here), we described this
 |
| Dow 20,000 |
dynamic as moving “the credit bubble from real estate speculation over to the corporate ledger side of business.” – adding, “Is that a healthier bubble? Probably. Will that put a strong bid under the market going forward over the next few years? Probably.” Penned under the auspicious, if not tongue-in-cheek headline, of Dow 20,000, the markets have come close to living up to that hyperbole. With that said, corporations have historically displayed the same deftness of individual investors, with all the prevalence’s to buy high – or stand like a deer in headlights when the equity markets turn south. Not surprisingly, contrarian thought appears to have no place in the gilded halls of corporate finance. What happens when the QE spigot turns off? As the demand/supply balances shift in the markets and equities come under pressure from (fill in the blank), market participants swiftly turn back to Treasuries and buttress negative feedback pressures in the equity markets.
Circling back to more Rumsfeldian wisdom, a known unknown, was what effects the ECB could have on the US markets as the Fed walked away. Just a few weeks back the music was playing sweetly – the mood was festive. There was a cadence being carried between the Fed and the ECB, that at first blush implied the party could continue – and it was the beginning of the end of the bond market bubble. Sell bonds, they said… Over the past week, between the disappointments with the ECB meeting and the recent candid, but disheartening, comments from Draghi seemingly directed at Germany – the path of least resistance in equities has been lower, with the Treasury market receiving the broadest support. In some ways the political and market conditions in Europe is reminiscent of our own reluctant embrace of the Fed’s extraordinary measures introduced at the end of 2008, but only really brought up to potent efficacy, deep into battle and pushed to the markets breaking limits. The question remains – will the German’s still be atheists in a foxhole. Gun to their heads – we doubt it, but certainly wouldn’t handicap how close they come to pulling or stumbling on that trigger. Will the DAX below 9,000, 8,000 or 6,000 bring them eye to eye with Draghi?
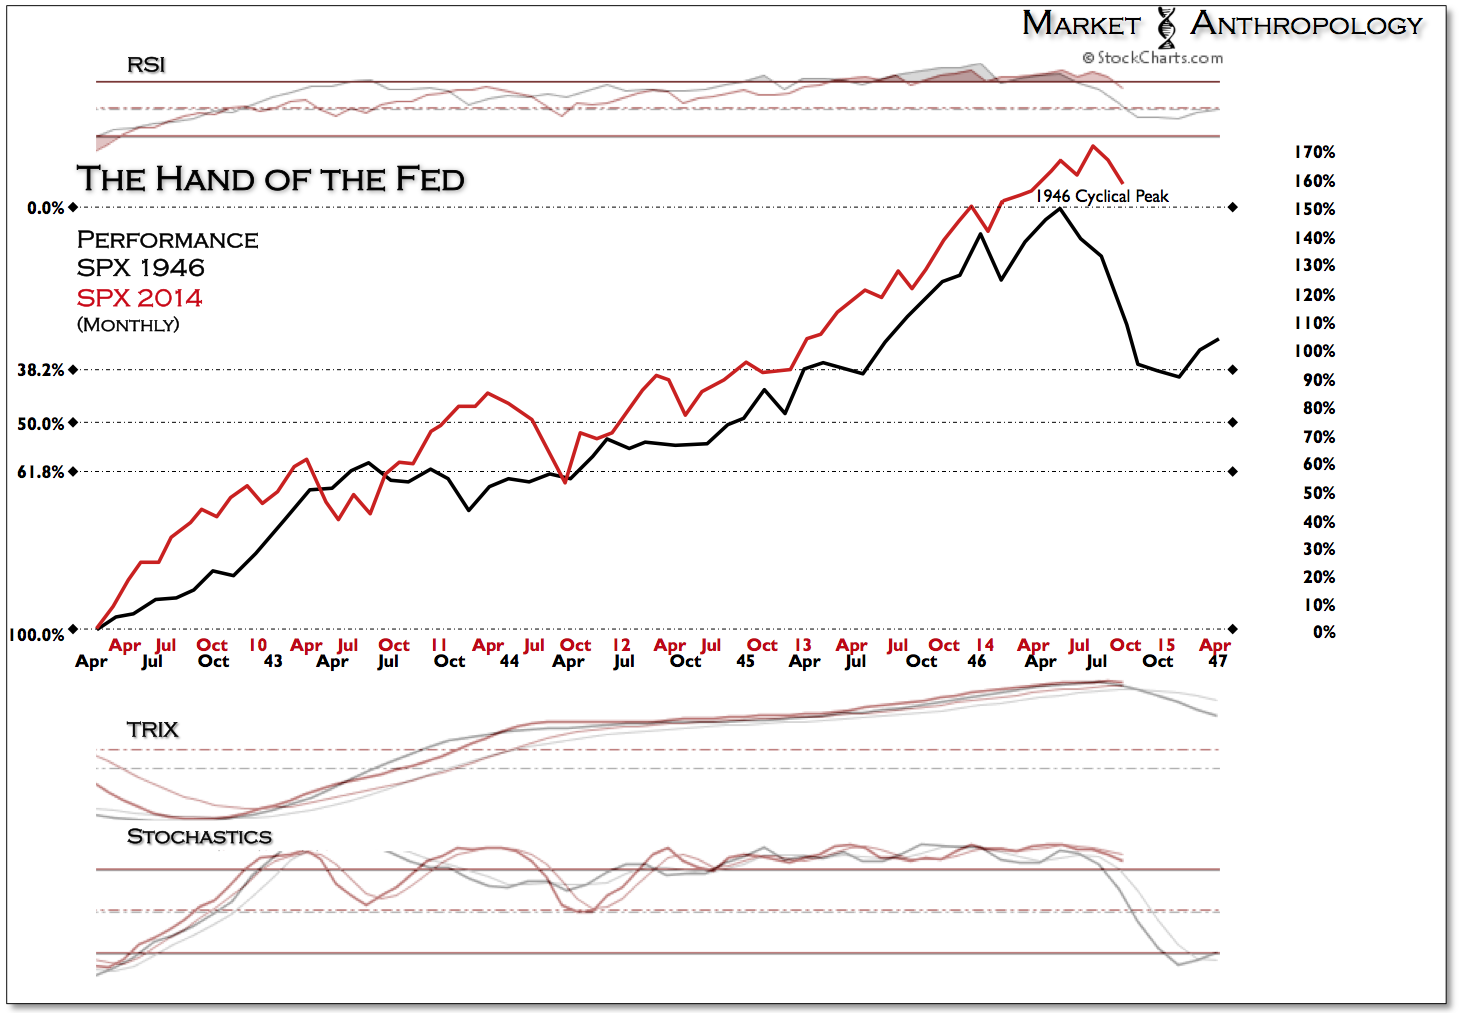
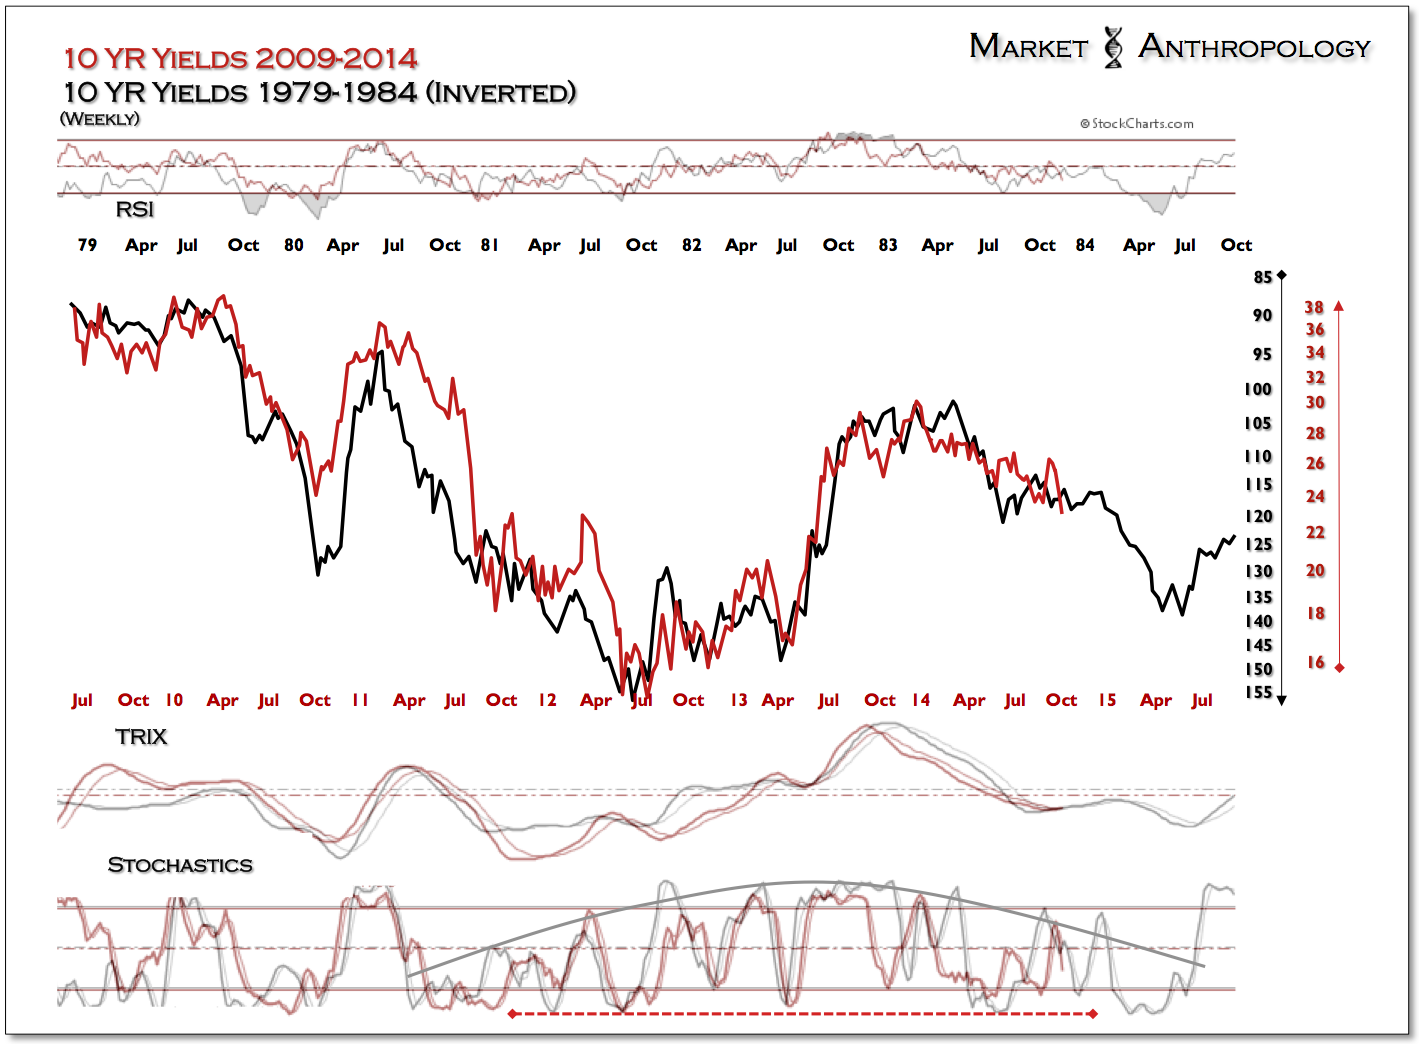
Over the past several months we have drawn parallels to both the equity and Treasury markets of the 1940’s and believe the current market environment rhymes much closer with this time period, than the more recent Fed tightening regimes we continue to see referenced on a weekly basis or the two most recent bear markets that respectively began in 2000 and 2007. On one hand, we are reminded that this isn’t the 1970’s, where long-term yields rose rapidly with inflation expectations; and this isn’t the pre-ZIRP periods of the 1980’s, 90’s – or even this centuries first decade, which enjoyed a fed funds rate that could maneuver on both sides of the road. This is a place we have playfully referred to as Esoterica – an unfamiliar territory for several participant generations, that we have found the closest parallels with the mirror of the long-term yield environment of the mid 1940’s.
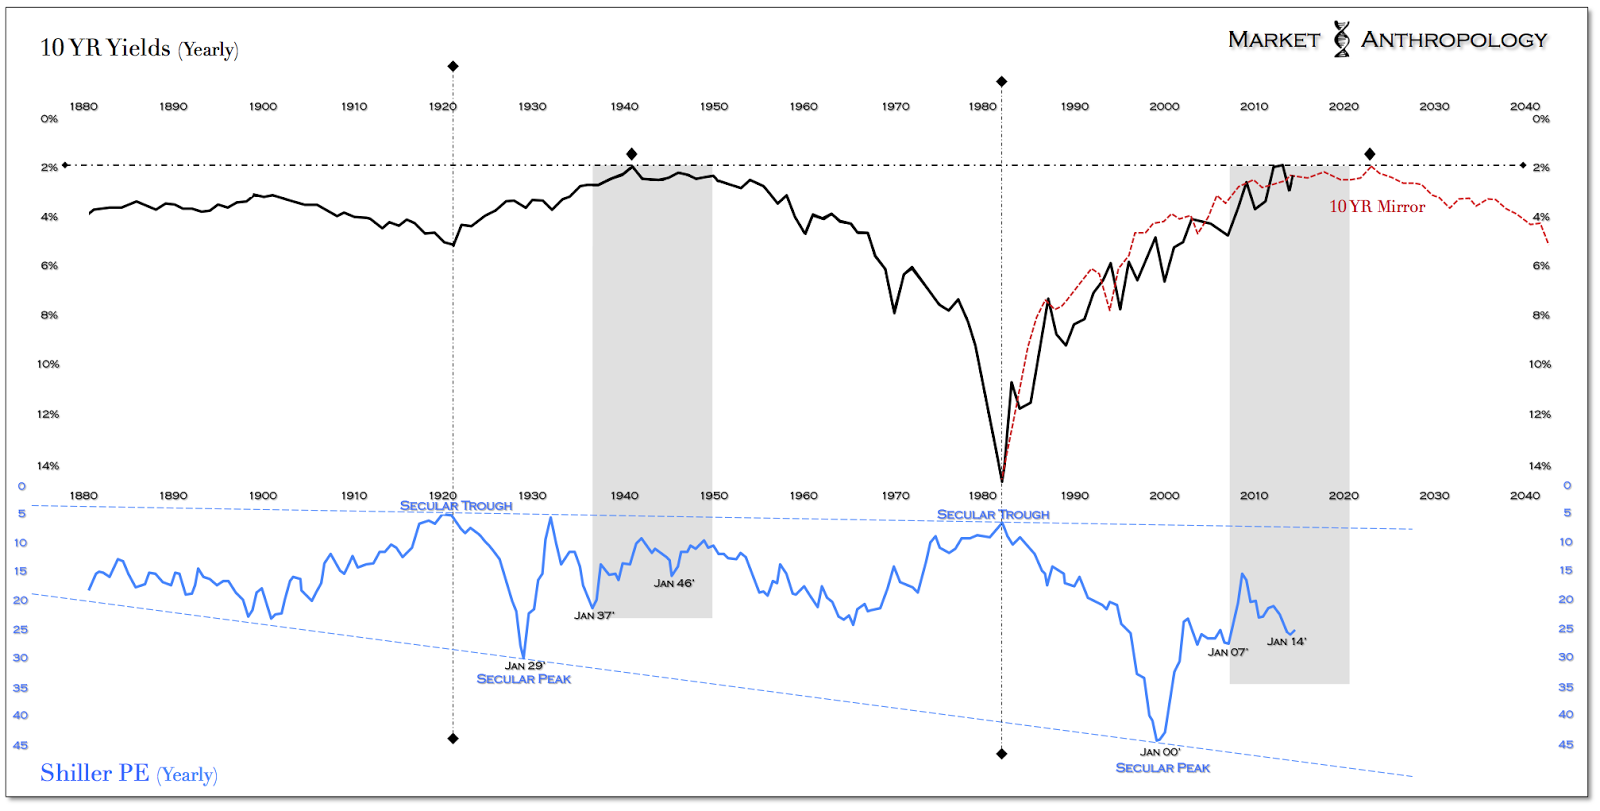
Another significant condition comparable with the 1940’s, is the Fed and Treasury actively intervened and bought market securities in somewhat similar proportions (debt/GDP), between the cyclical low in equities in 1942 and the cyclical peak in 1946. Reminiscent of the current lackluster fundamental backdrop that has diverged over recent years from the stoic strength of the equity markets, the massive bond buying program in the 1940’s had a much stronger correlation to the capital markets it directly affected, than the macro climate that most economists appraise.


Nevertheless, just as participants have put the cart before the horse when it comes to expectations of the Fed raising rates next year, we would caution that looking for an equity market slide 10 to 30 percent lower, would likely take a more circuitous path, than last weeks action might imply. While we continue to favor long-term Treasuries relative to equities, on a short-term time horizon, the equity markets are significantly stretched to the downside – and conversely, long-term Treasuries are significantly overbought.
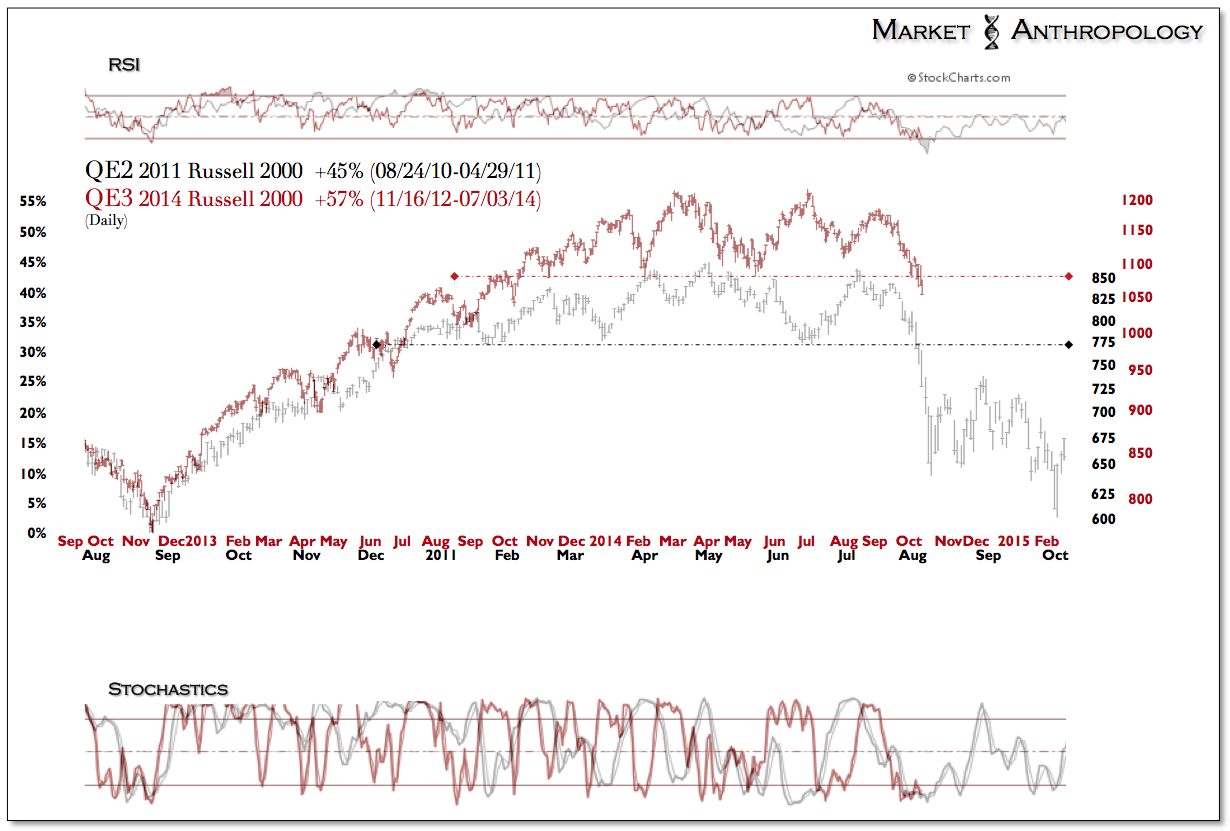
That being said, small caps continue to receive the brunt of the sell-off in the US, as nervous capital has climbed up the stairs from the higher beta corners, to the relative safety in large cap stocks. Comparatively speaking, while QE3 has run longer than the preceding programs, small caps have loosely followed the distribution pattern following the end of QE2. Namely, once the market rejected new highs in July, the subsequent secondary attempts and failures, served as further confirmation that the underlying market character and psychology has changed. A notable contrast with today, is that correlation conditions across markets in 2011 were near historic extremes going into August, as support gave way across indexes and asset classes – as traders ran for the exits in unison. While we would expect correlations between markets to tighten with further weakness, the conditions that helped give way to the cascade structures in 2011 are currently not present.